Contributed by Kunal Pariani from NGINX
If you have trouble running the example or have suggestions for improvement, please create a Github issue and copy Kunal Pariani @kunalvjti in it.
This Getting Started with Elastic Stack example provides sample files to ingest, analyze & visualize Nginx Plus logs obtained from its status API using the Elastic Stack, i.e. Elasticsearch, Filebeat and Kibana. The logs obtained from the status API are in JSON format.
This example historically used Logstash for ingestion. Per recommended best practices this is now achieved with Filebeat. The Logstash configuration is provided for reference only.
Example has been tested with following versions:
- Elasticsearch 6.0
- Filebeat 6.0
- Kibana 6.0
- nginxplus_json_logs - Sample JSON Nginx Plus log files
- nginxplus_filebeat.yml - Filebeat configuration for ingesting JSON files.
- nginxplus_json_kibana.json - Custom Kibana dashboard.
- nginxplus_json_template.json - ES Template for ingestion.
- nginxplus_json_pipeline.json - ES Pipeline for ingestion.
- nginx_json_logstash.conf - Logstash configuration. REFERENCE ONLY.
-
Follow the Installation & Setup Guide to install and test the Elastic Stack (you can skip this step if you have a working installation of the Elastic Stack,)
-
Run Elasticsearch & Kibana
<path_to_elasticsearch_root_dir>/bin/elasticsearch <path_to_kibana_root_dir>/bin/kibana -
Check that Elasticsearch and Kibana are up and running.
- Open
localhost:9200in web browser -- should return status code 200 - Open
localhost:5601in web browser -- should display Kibana UI.
Note: By default, Elasticsearch runs on port 9200, and Kibana run on ports 5601. If you changed the default ports during/after installation, change the above calls to use appropriate ports.
- Open
-
Download and install Filebeat as described here. Do not start Filebeat
Download the following files in this repo to a local directory:
nginxplus_json_logs- sample JSON formatted Nginx Plus logs from its status APInginxplus_filebeat.yml- Filebeat config for ingesting data into Elasticsearchnginxplus_json_template.json- template for custom mapping of fieldsnginxplus_json_kibana.json- config file to load prebuilt Kibana dashboardnginxplus_json_pipeline.json- Ingestion pipeline
Unfortunately, Github does not provide a convenient one-click option to download entire contents of a subfolder in a repo. Use sample code provided below to download the required files to a local directory:
wget https://raw.githubusercontent.com/elastic/examples/master/Common%20Data%20Formats/nginx_json_plus_logs/nginxplus_filebeat.yml
wget https://raw.githubusercontent.com/elastic/examples/master/Common%20Data%20Formats/nginx_json_plus_logs/nginxplus_json_kibana.json
wget https://raw.githubusercontent.com/elastic/examples/master/Common%20Data%20Formats/nginx_json_plus_logs/nginxplus_json_template.json
wget https://raw.githubusercontent.com/elastic/examples/master/Common%20Data%20Formats/nginx_json_plus_logs/nginxplus_json_pipeline.json
wget https://raw.githubusercontent.com/elastic/examples/master/Common%20Data%20Formats/nginx_json_plus_logs/nginxplus_json_logs
** The JSON formatted logs used in this example were created using status API of NGINX Plus. Please refer to Live activity monitoring with NGINX Plus for more information on how to use status API of NGINX Plus
-
Move the file
nginx_json_filebeat.ymlto the Filebeat installation directory i.e.mv nginxplus_filebeat.yml <filebeat_installation_dir>/nginxplus_filebeat.yml
-
Install the ingest pipeline
curl -XPUT -H 'Content-Type: application/json' 'localhost:9200/_ingest/pipeline/nginxplus_json_pipeline' -d @nginxplus_json_pipeline.json
-
Install the Elasticsearch template
curl -XPUT -H 'Content-Type: application/json' 'localhost:9200/_template/nginxplus_json' -d @nginxplus_json_template.json
-
Start Filebeat to begin ingesting data to Elasticsearch, modifying the command below to point to your Elasticsearch instance and the sample log file
nginxplus_json_logs. Ingestion should take around a few seconds.cd <filebeat_installation_dir> ./filebeat -e -c nginxplus_filebeat.yml -E "output.elasticsearch.hosts=["localhost:9200"]" -E "filebeat.prospectors.0.paths=["<path to nginxplus_json_logs>"]" ``
-
Verify that data is successfully indexed into Elasticsearch
Running http://localhost:9200/nginxplus_json/_count should return a response a "count":500
- Access Kibana by going to
http://localhost:5601in a web browser - Connect Kibana to the
nginxplus_jsonindex in Elasticsearch (auto-created in step 1)- Click the Management tab >> Index Patterns tab >> Add New. Specify
nginxplus_jsonas the index pattern name and click Create to define the index pattern, using the @timestamp field as the Time-Field. - If this is the only index pattern declared, you will also need to select the star in the top upper right to ensure a default is defined.
- Click the Management tab >> Index Patterns tab >> Add New. Specify
- Load sample dashboard into Kibana
- Click the Settings tab >> Saved Objects tab >> Import, and select
nginxplus_json_kibana.json - On import you will be asked to overwrite existing objects - select "Yes, overwrite all". Additionally, select the index pattern "nginxplus_json" when asked to specify a index pattern for the dashboards.
- Click the Settings tab >> Saved Objects tab >> Import, and select
- Open dashboard
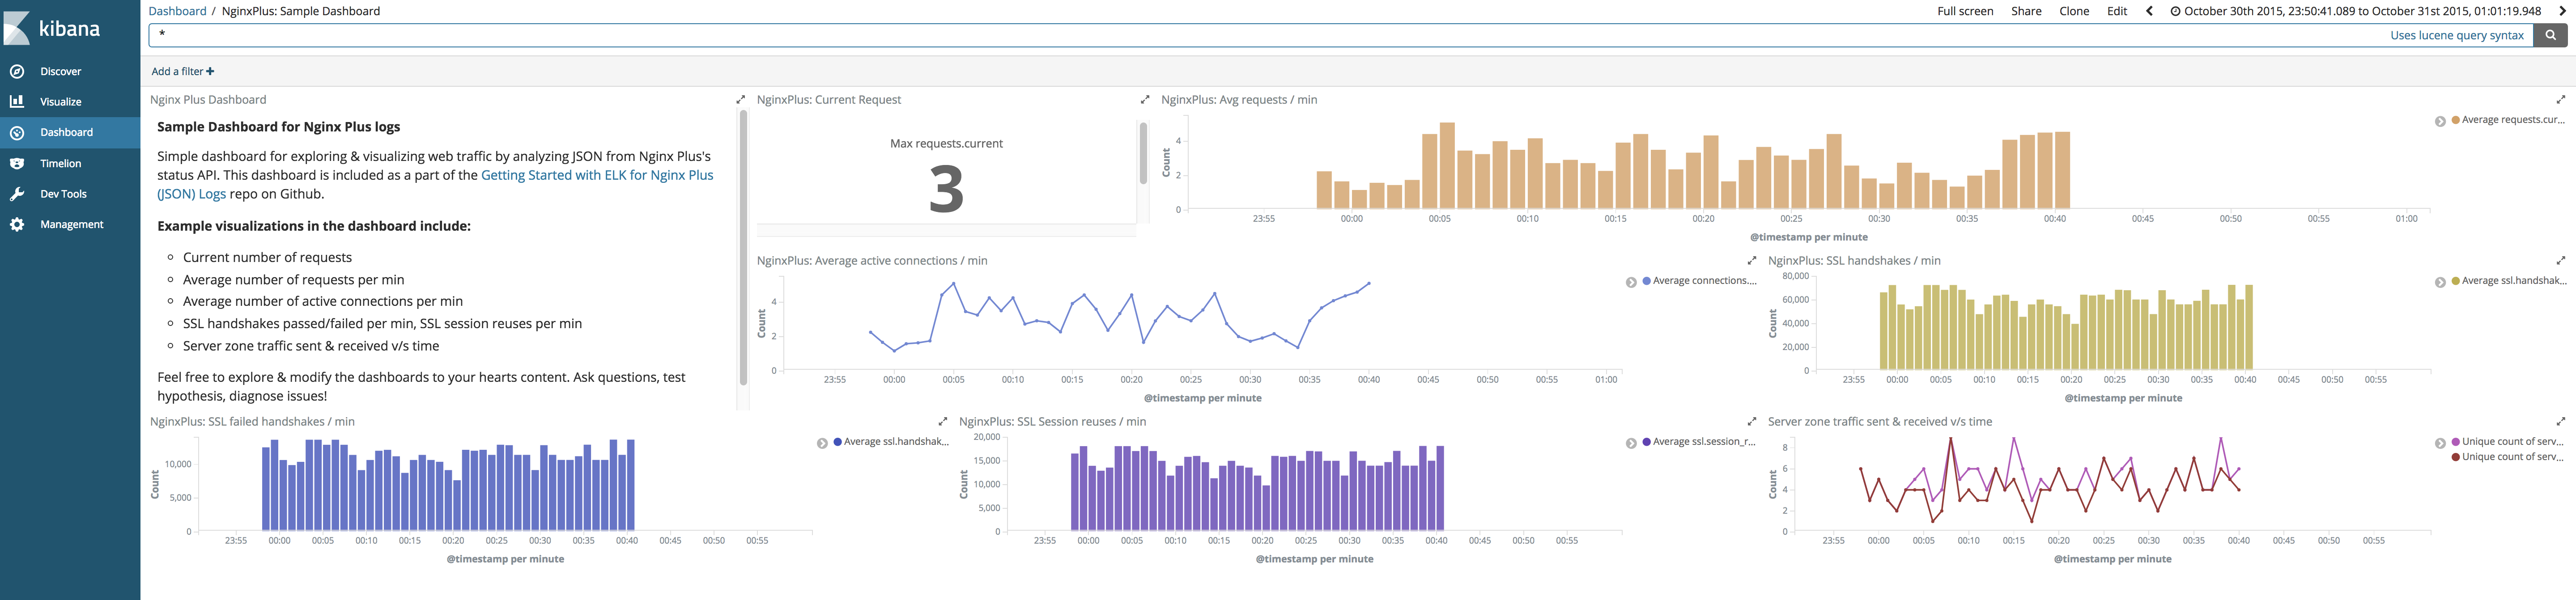
- Click on Dashboard tab and open
NginxPlus: Sample Dashboarddashboard
- Click on Dashboard tab and open
Voila! You should see the following dashboard. Enjoy!