The Apache Tomcat mixin is a set of configurable Grafana dashboards and alerts.
The Apache Tomcat mixin contains the following dashboards:
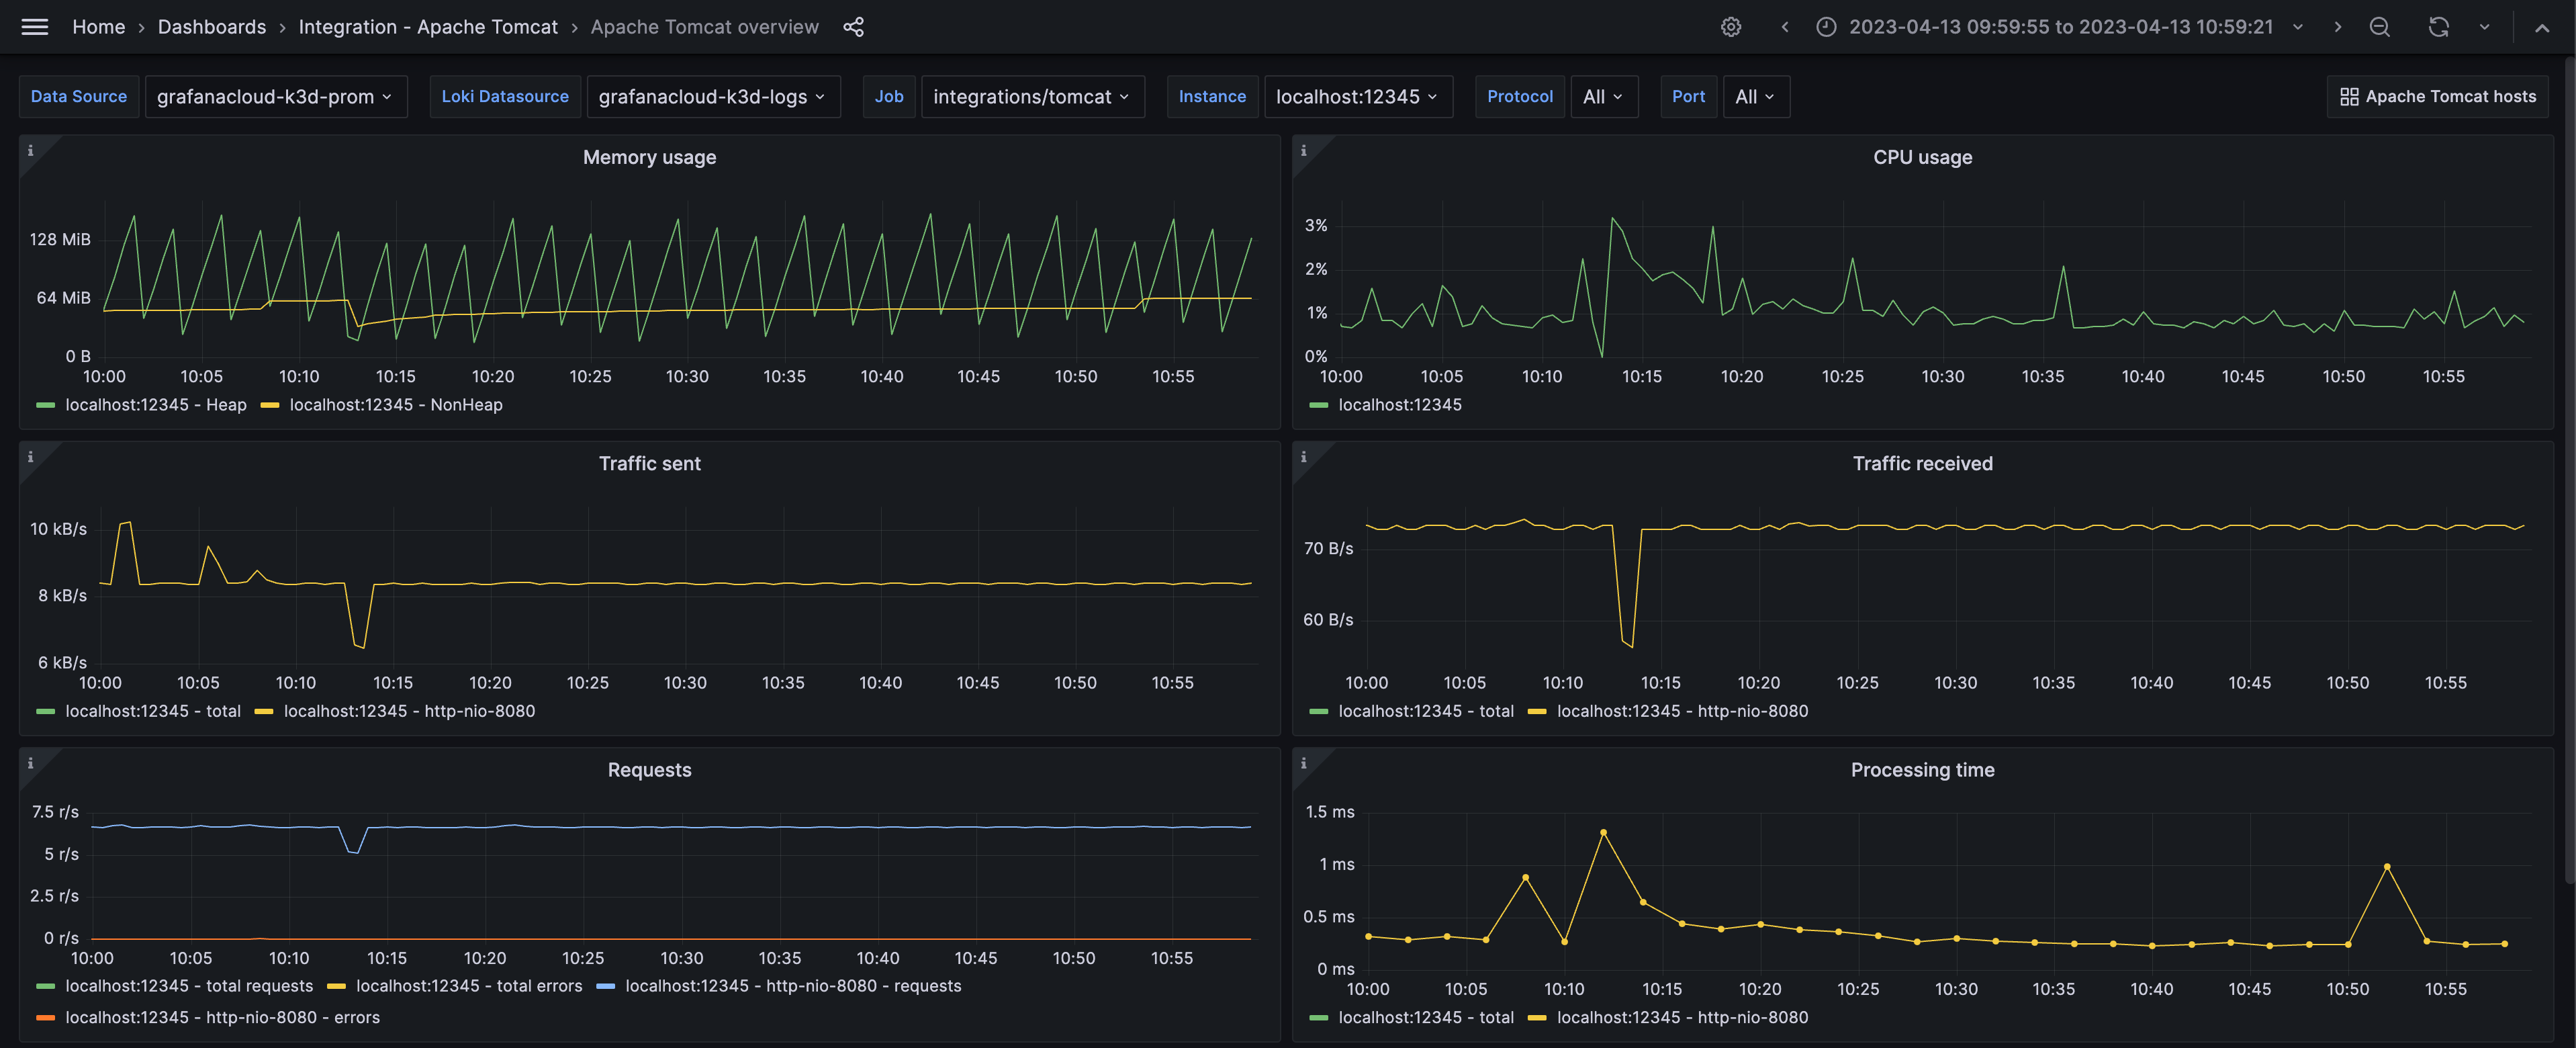
- Apache Tomcat overview
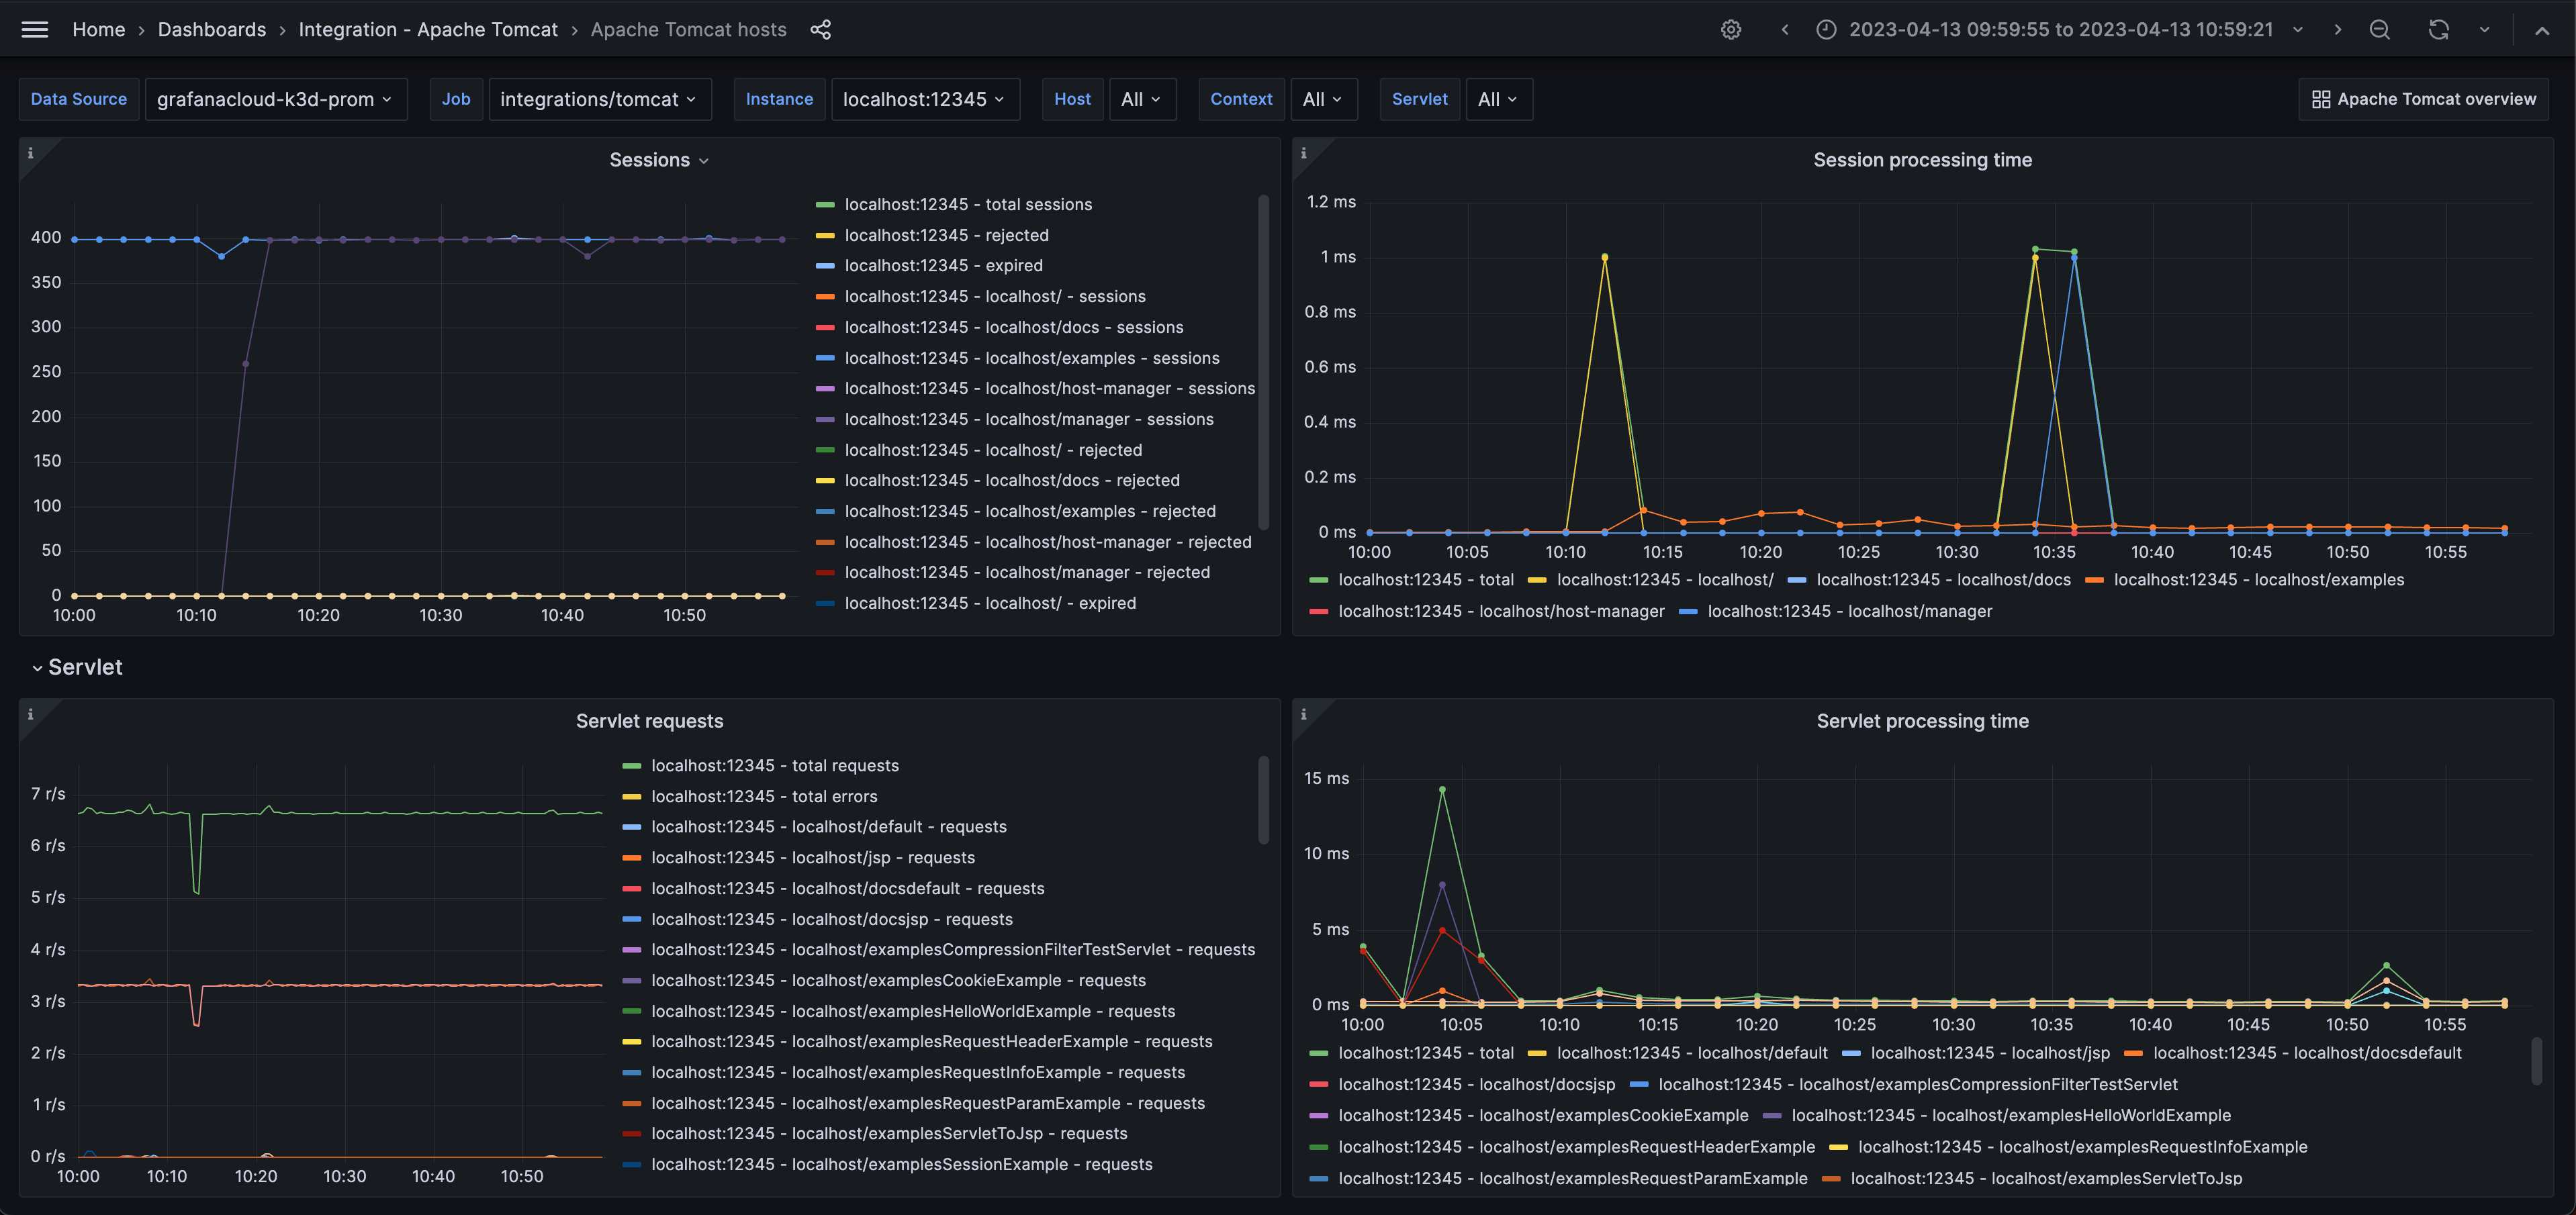
- Apache Tomcat hosts
and the following alerts:
- ApacheTomcatAlertsHighCpuUsage
- ApacheTomcatAlertsHighMemoryUsage
- ApacheTomcatAlertsHighRequestErrorPercent
- ApacheTomcatAlertsModeratelyHighProcessingTime
Default thresholds can be configured in config.libsonnet.
{
  _config+:: {
    ApacheTomcatAlertsCriticalCpuUsage: 80,  //%
    ApacheTomcatAlertsCriticalMemoryUsage: 80,  //%
    ApacheTomcatAlertsCriticalRequestErrorPercentage: 5,  //%
    ApacheTomcatAlertsWarningProcessingTime: 300,  //ms
  },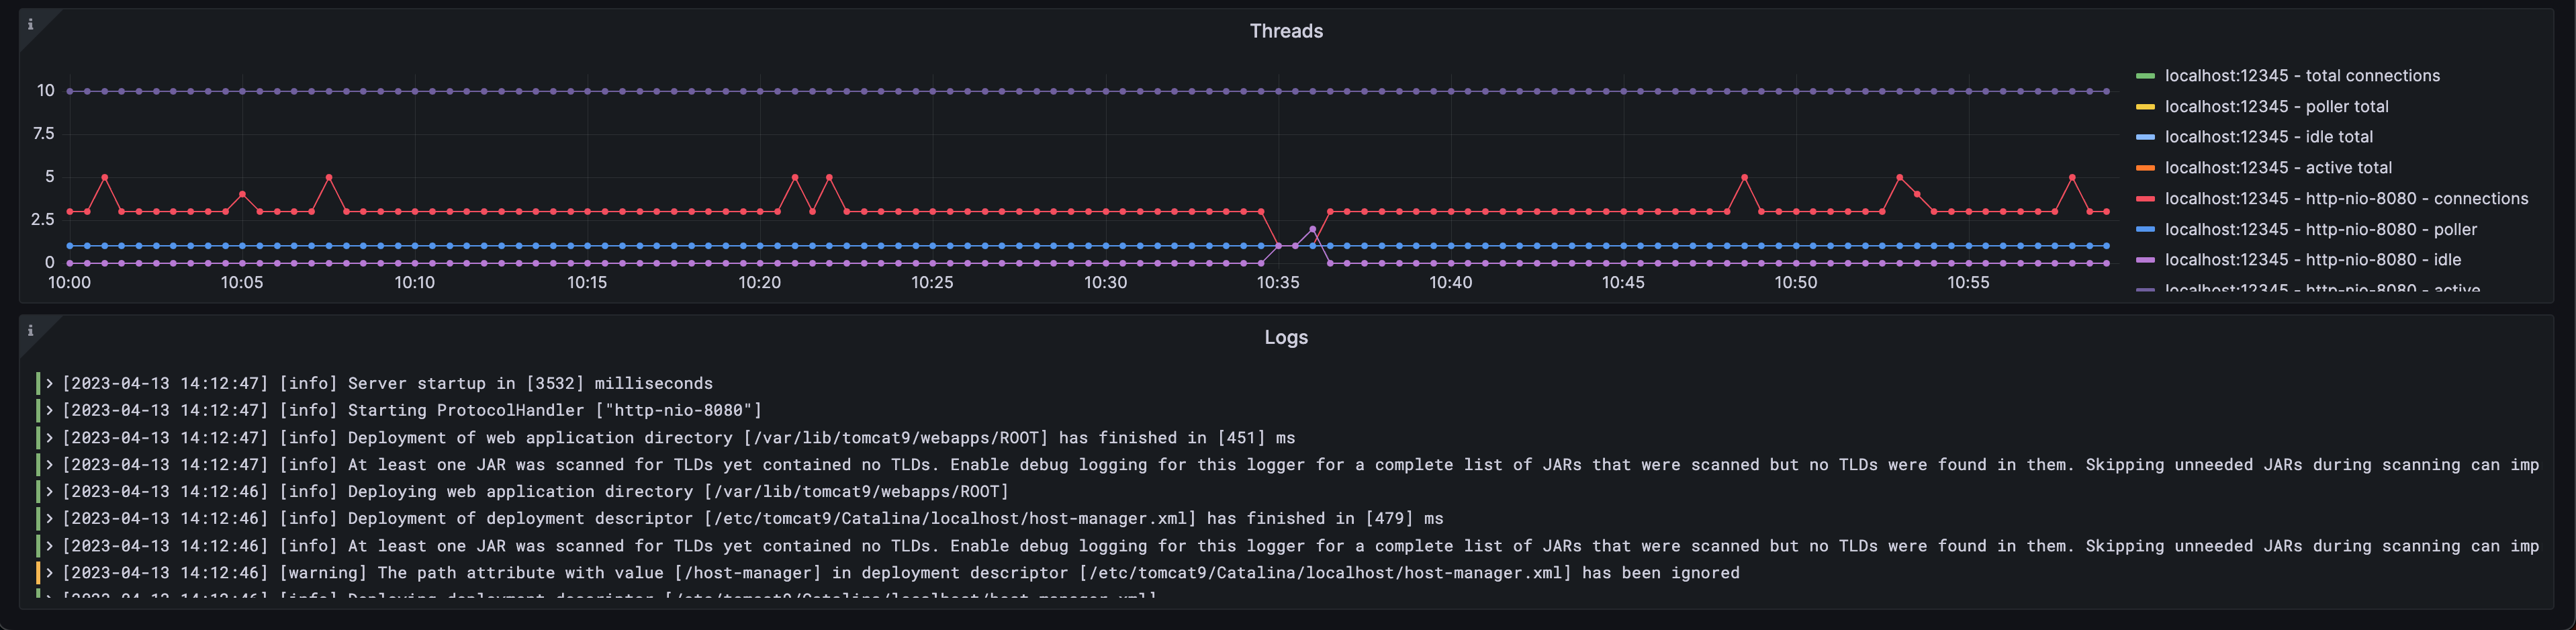
}The Apache Tomcat overview provides details on memory/cpu usage, traffic sent/received, request processing time, number of threads, and output logs for a Tomcat instance.
To get Tomcat output logs, Promtail and Loki needs to be installed and provisioned for logs with your Grafana instance. The default Tomcat output log path is /var/log/tomcat*/catalina.out on Linux and C:\Program Files\Apache Software Foundation\Tomcat *.*\logs\catalina.out on Windows.
Tomcat output logs are enabled by default in the config.libsonnet and can be removed by setting enableLokiLogs to false. Then run make again to regenerate the dashboard:
{
  _config+:: {
    enableLokiLogs: false,
  },
}
The Apache Tomcat hosts dashboard provides details on number of sessions, session processing time, number of servlet requests, and servlet processing time.
ApacheTomcatAlertsHighCpuUsage: The instance has a CPU usage higher than the configured threshold. ApacheTomcatAlertsHighMemoryUsage: The instance has a higher memory usage than the configured threshold. ApacheTomcatAlertsHighRequestErrorPercent: There are a high number of request errors. ApacheTomcatAlertsModeratelyHighProcessingTime: The processing time has been moderately high.
go install github.com/jsonnet-bundler/jsonnet-bundler/cmd/jb@latest
go install github.com/monitoring-mixins/mixtool/cmd/mixtool@latest
For linting and formatting, you would also need jsonnetfmt installed. If you
have a working Go development environment, it's easiest to run the following:
go install github.com/google/go-jsonnet/cmd/jsonnetfmt@latestThe files in dashboards_out need to be imported
into your Grafana server. The exact details will be depending on your environment.
prometheus_alerts.yaml needs to be imported into Prometheus.
Edit config.libsonnet if required and then build JSON dashboard files for Grafana:
makeFor more advanced uses of mixins, see https://github.com/monitoring-mixins/docs.