performance-monitor为开源的服务器资源监控工具,采用shelll + python语言开发,具有灵活的监控配置
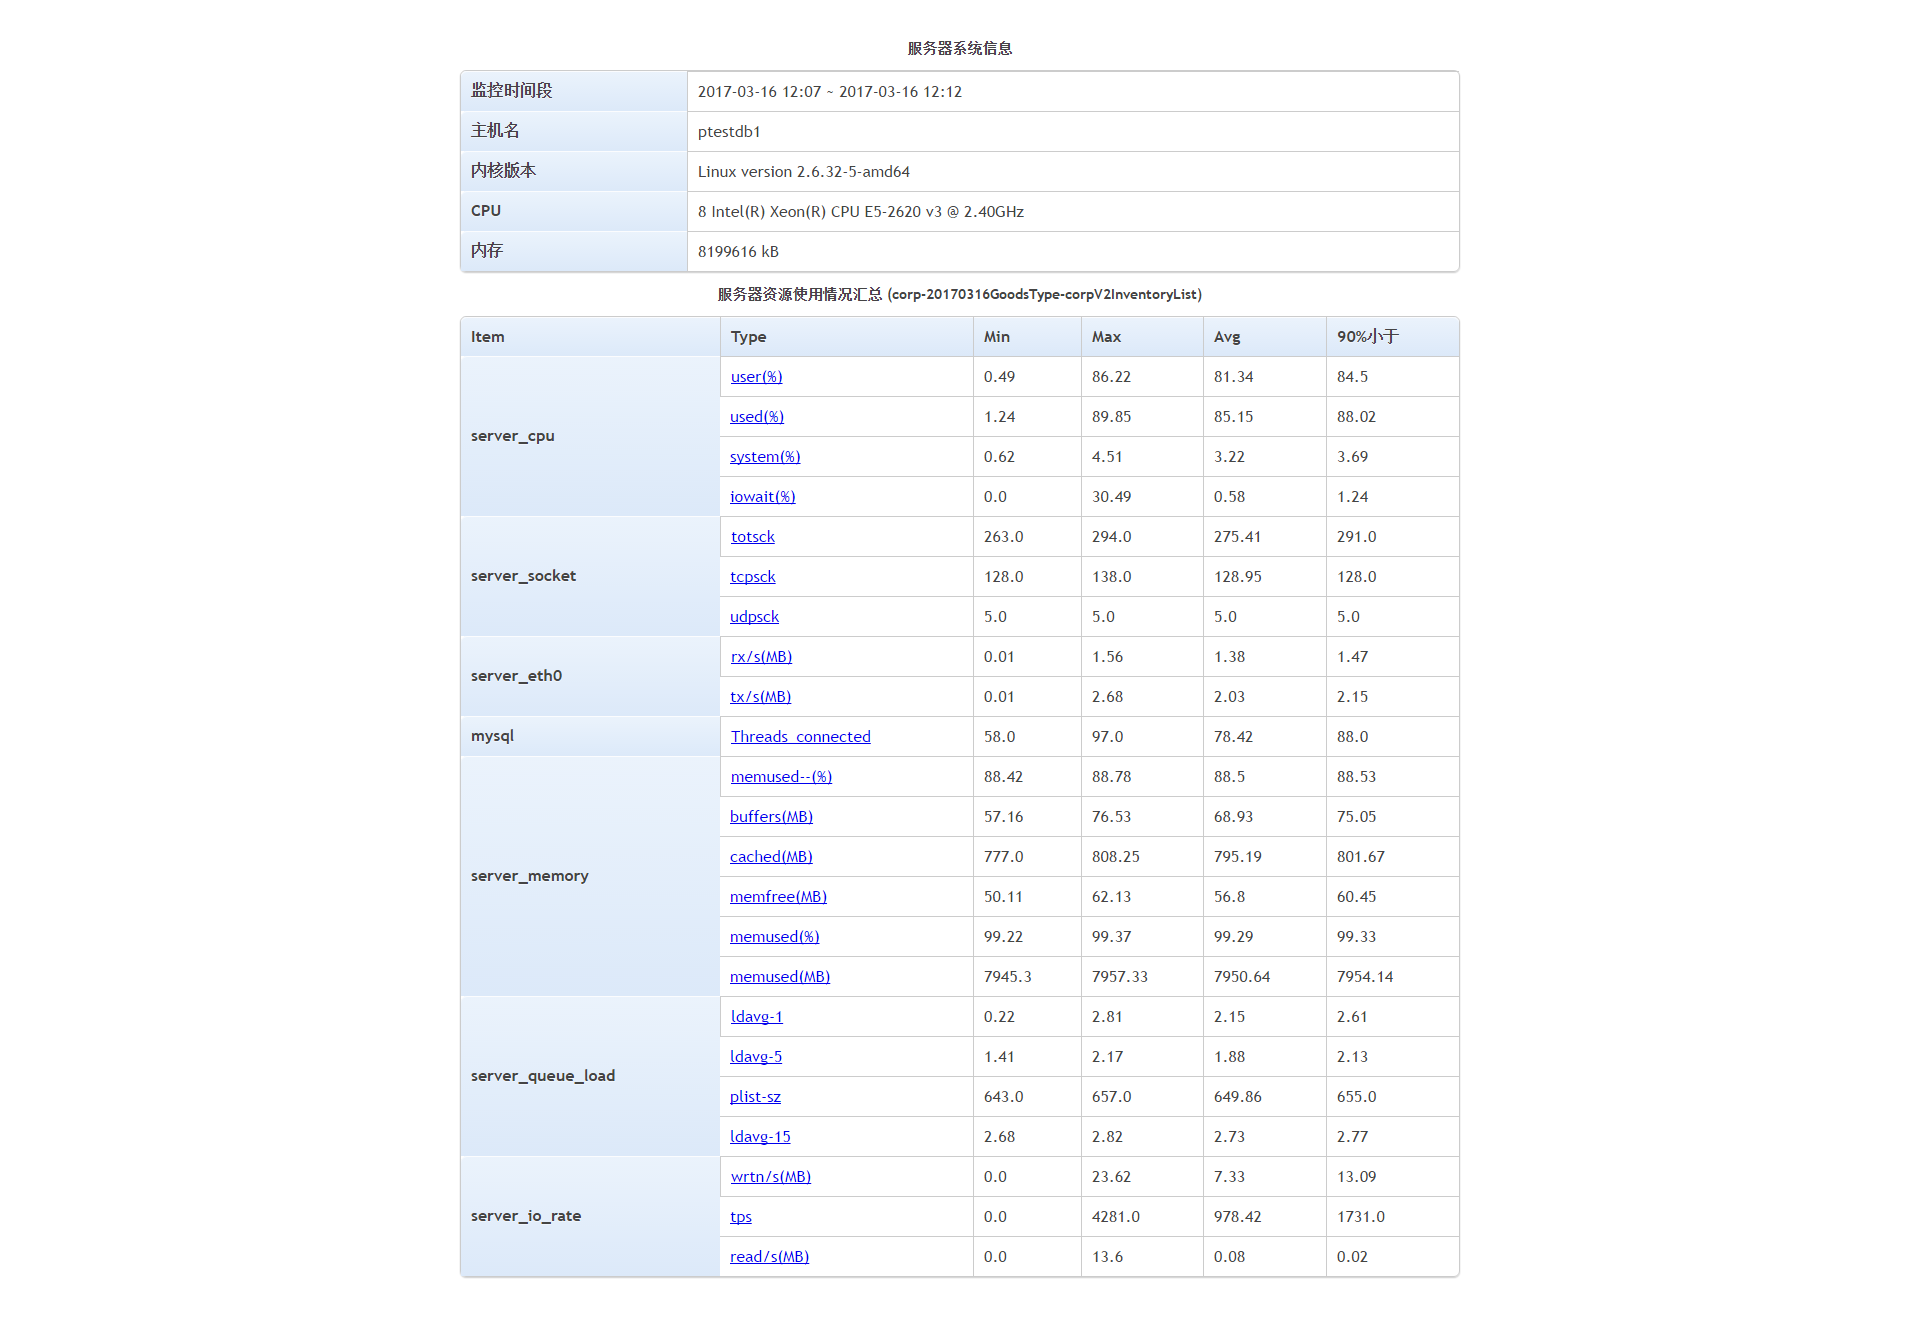
performance monitor用于监控linux服务器中的资源情况,包括:
- server_cpu -- 服务器CPU资源情况(sar)
iowait(%) -- iowait占用CPU百分比,一般不应该超过30%system(%) -- 内核空间占用CPU百分比used(%) -- 100%-idle(%)user(%) -- 用户空间占用CPU百分比
- server_eth0 -- 服务器网卡eth0资源情况(sar -n DEV)
rx/s(MB/s) -- 接收速度tx/s(MB/s) -- 发送速度
- server_eth1 -- 服务器网卡eth1资源情况(sar -n DEV)
rx/s(MB/s) -- 接收速度tx/s(MB/s) -- 发送速度
- server_io_rate -- 服务器IO资源情况(sar -b)
read/s(MB) -- 每秒物理设备读取数据总量wrtn/s(MB) -- 每秒物理设备写入数据总量tps -- 每秒物理设备IO操作次数(Total number of transfers per second that were issued to physical devices)
- server_memory -- 服务器内存资源情况(sar -r)
buffers(MB) -- 内核缓冲区占用内存大小cached(MB) -- 内核高速缓存数据占用内存大小memfree(MB) -- 空闲内存大小memused(MB) -- 已使用内存大小memused(%) -- 已使用内存百分比memused--(%) -- (memused-cached-buffers)*100%/(memfree+memused)
- server_queue_load -- 服务器CPU负载情况(sar -q)
ldavg-1 -- 1分钟load平均值ldavg-5 -- 5分钟load平均值ldavg-15 -- 15分钟load平均值plist-ze -- 队列中的进程和线程数量
- server_socket -- 服务器socket资源情况(sar -n SOCK)
totsck -- 总的socket数量tcpsck -- tcp连接socket数量udpsck -- udp连接socket数量
- process_xxx -- 进程占用资源情况(top, ps -mP)
CPU(%) -- 占用CPU百分比(每个核占用百分比之和)MEM(%) -- 占用物理内存百分比Threads -- 进程对应线程数
- mysql -- mysql数据库连接数(show global status like 'Threads_connected';)
Threads_connected
- redis -- redis信息(redis info)
connected_clients -- 客户端连接数hit_rate -- 命中率(keyspace_hits*100%/(keyspace_hits+keyspace_misses))instantaneous_ops_per_sec -- 每秒处理请求数量keyspace_hits -- 总命中数量keyspace_misses -- 总不命中数量total_commands_processed -- 总的请求数量use_memory(MB) -- 使用内存大小use_memory_peak(MB) -- 使用的最大内存大小
- memcached --memcached状态(client.get_stats())
accepting_conns -- 接收的请求数bytes -- 处理的字节数量bytes_read -- 读操作的字节数量bytes_written -- 写操作的字节数量cmd_flush -- flush命令总请求数量cmd_get -- get命令总请求数量cmd_set -- set命令总请求数量curr_connections -- 当前打开这的连接数curr_items -- 当前存储的items数量evictions -- 为了获取空闲内存而删除的items数get_hits -- 总命中次数get_misses -- 总不命中次数hit_rate -- 命中率(get_hits*100%/(get_hits+get_misses))limit_maxbytes -- 分配给memcached内存大小threads -- 当前线程数total_items -- 从服务启动以后存储的items总数量
- mongodb -- mongodb信息(mongostat)
conn -- 当前连接数delete -- 每秒删除次数faults -- 每秒访问失败数flushes -- 每秒执行fsync将数据写入硬盘的次数getmore -- 每秒执行getmore次数insert -- 每秒插入次数mapped(MB) -- 所有的被mmap的数据量non-mapped(MB) -- MongoDB's internal data structures and threads'stacks, essentially anything not backed by files on diskquery -- 每秒查询数量res(MB) -- 物理内存使用量update -- 每秒更新次数vsize(MB) -- 虚拟内存使用量
- apache --apache状态(status页面)
closing_connection -- 关闭连接状态(C)currently_processed -- 近期处理的请求数量dns_lookup -- 正在查找DNS状态(D)gracefully_finishing -- 进入正常结束程序中状态(G)idle_cleanup_of_worker -- 处理闲置状态(I)idle_worker -- 空闲线程keepalive_read -- 处于保持联机的状态(K)logging -- 正在写入日志文件open_slot_with_no_current_processreading_request -- 正在读取请求状态(R)sending_reply -- 正在发送回应(W)starting_up -- 启动中(S)waiting_for_connection -- 等待连接中(_)
- tomcat --tomcat状态(status页面)
free_memory -- 空闲内存total_memory -- 总的使用内存%ps_eden_space -- 年轻代(Eden Space)使用百分比%ps_old_gen -- 年老代使用百分比%ps_survivor_space -- 年轻代(Survivor Space)使用百分比max_threads -- 最大线程数量current_thread_count -- 近期线程数量current_thread_busy -- 近期忙线程数量max_processing_time -- 最大处理时间processing_time -- 处理时间
- nginx -- nginx状态(status页面)
active_connections -- 激活的连接数handled_connections -- 处理的连接数handled_handshake -- 处理的握手数handled_requests -- 处理的请求数reading -- 读取操作waiting -- 等待操作writing -- 写入操作
- apt-get install build-essential
- apt-get install libssl-dev
- 自行安装python2.7+,setuptools和pip
- apt-get install libfreetype*
- apt-get install libpng*
- apt-get install sysstat
- apt-get install libmysqld-dev
- apt-get install zip
- pip2.7 install virtualenv (可选,若需要在python虚拟环境中运行,则需安装)
- pip2.7 install -r requirements.txt
配置config目录下的config.ini和report.ini
cd performance_monitor/bin
./monitor_start.sh -i interval -c count [-t time] -f prefix_name
参数说明:
-i 采样间隔
-c 采样次数
-t 采样时长(如果你使用了-t设置时长 ,脚本将会忽略-c采样次数)
-f 数据文件名前缀 例子: test-v1.0-api (使用'-'作为分隔符,请勿使用'_' )
结束后可到result目录中查看对应的输出表单和数据