Performance results from CLI, Node, Audit and Extension are very different #9957
Description
Provide the steps to reproduce
There are 4 ways to use Lighthouse
- Audits in Chrome DevTools
- Chrome Lighthouse Extension
- Node CLI
- Node Module
Setup the server
- Fetch html
- Only change one line: var Loop=2e7 to see the difference.
- Open this with Live Server [^1]
Get the 4 different results
- F12, Click Audits, Get
Audit.zip - Run Lighthouse Extension, Get
Extension.zip - Run Lighthouse CLI: lighthouse http://127.0.0.1:5501/Canvas_Sin.html --view --output-path=LightHouse_Output\Canvas --output=html --only-categories=performance
Get Canvas.report.html output.zip - Follow Node Module
Get result
Node_LightHouseOutput.zip
What is the current behavior?
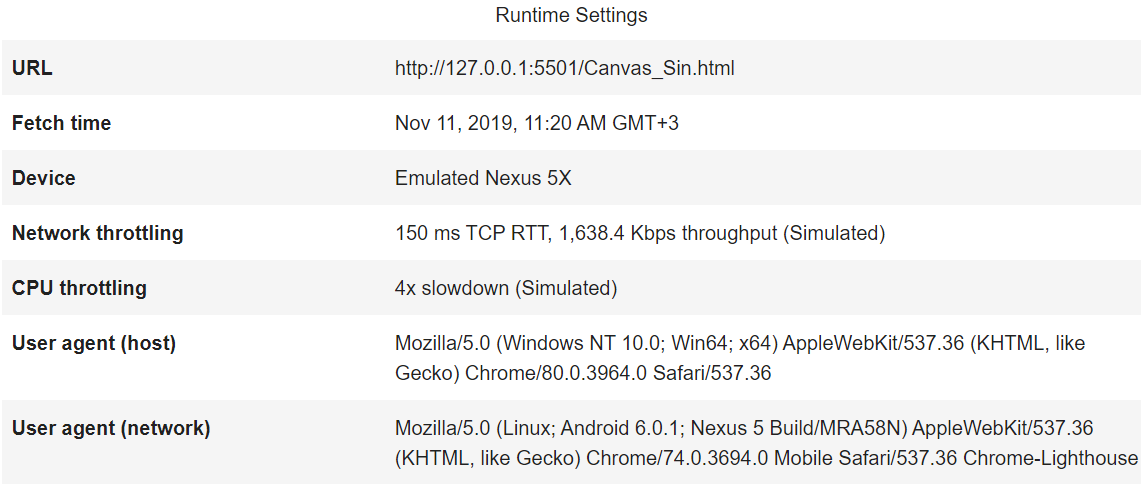
Please see the part of performance results from 4 different ways. All 4 ways use same setting:
-
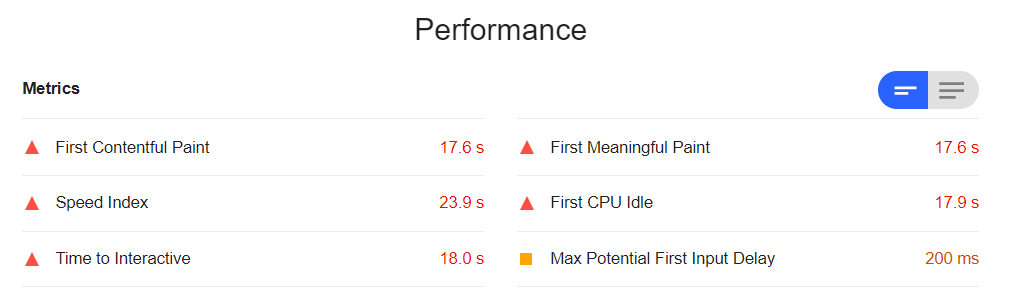
Performance from Audits:
CPU/Memory Power: 680
-
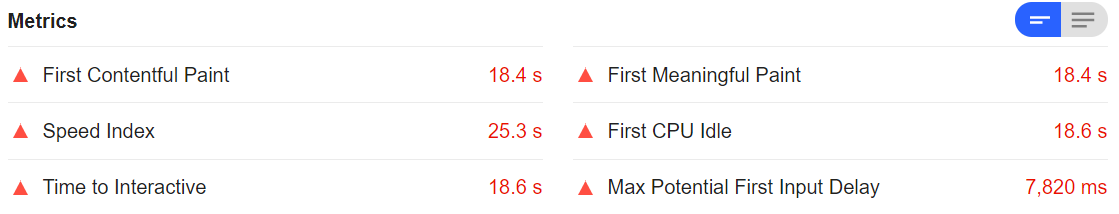
Performance from Extension:
CPU/Memory Power: 613
-
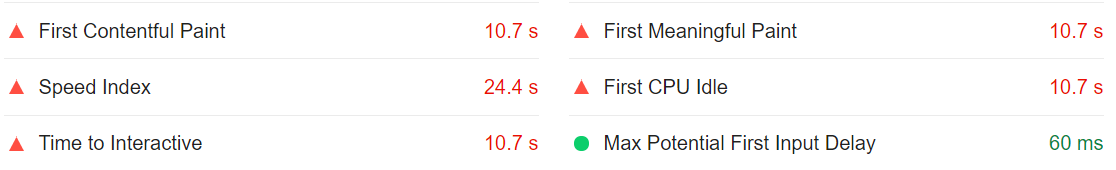
Performance from node CLI:
CPU/Memory Power: 540
-
Performance from node Module:
CPU/Memory Power: 707
What is the expected behavior?
The 4 ways should give very close result. But there are a lot of difference.
- Why CPU/Memory is so different for 4 ways? How this is calculated?
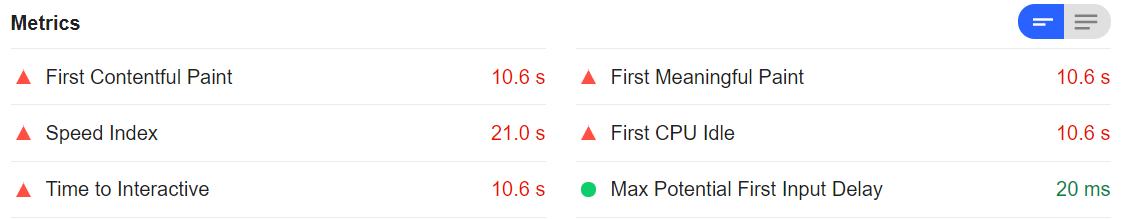
- Max Potential First Input Delay is huge different, from 20 to 7820ms.
- For other performance, First Contentful Paint,First Meaningful Paint,Speed Index,First CPU Idle and Time to Interactive, although Audit is close to Extension; CLI is close to Module, but there is about 1.6 times difference between CLI and Audit.
What is the best way we should use in the future?
Based on the above performance result, Node Module gives the best performance result. Extension shows the worst performance.
Environment Information
- Lighthouse version: 5.6.0
- Lighthouse Extension: 5.6.0
- Chrome version: 78.0.3904.97
- Node.js version: 12.11.1
- Operating System: Win10X64 1803
- VS Code: Version: 1.40.0
- [^1] Live Server Plugin of VS Code: 5.6.1
Related issues