Adds ranking table below the sunburst charts #1
Conversation
This file contains hidden or bidirectional Unicode text that may be interpreted or compiled differently than what appears below. To review, open the file in an editor that reveals hidden Unicode characters.
Learn more about bidirectional Unicode characters
Contributor
 alannahw
commented
alannahw
commented
Nov 1, 2017
- to display the top five offenders from the usage distribution
- made arc responsive to hover for visibility
- moved metrics number from under sunburst to center of diagram
* to display the top five offenders from the usage distribution
* made arc responsive to hover for visibility
* moved metrics number from under sunburst to center of diagram
Contributor
|
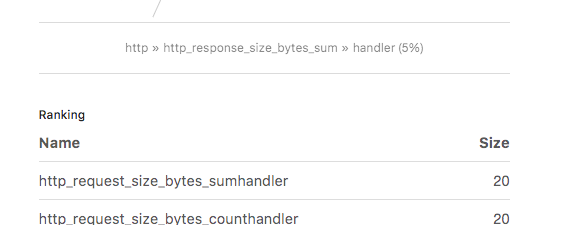
The code to the generate the tables is great. The CSS needs adapting though: This project uses basscss classes to express styles, and only does minimal adjustments with local classes (ideally there would be zero). The goal is maximum reusability in cases where sub-components are included into other projects. The fewer explicit styles are in this repo, the more freedom the super-project has in laying things out. Here is a screenshot on how the table looks when included in a super-project:
Concretely, I would ask you to look through the CSS changes of this PR and see if they can also be done via bass classes. Let's take it from there. Last thing: there needs to be a separation between the label and the metric name in each table row. |
* level names separated for legibility
* local css styling changed to basscss styling for consistency
Merged
Sign up for free
to join this conversation on GitHub.
Already have an account?
Sign in to comment
2 participants
Add this suggestion to a batch that can be applied as a single commit.
This suggestion is invalid because no changes were made to the code.
Suggestions cannot be applied while the pull request is closed.
Suggestions cannot be applied while viewing a subset of changes.
Only one suggestion per line can be applied in a batch.
Add this suggestion to a batch that can be applied as a single commit.
Applying suggestions on deleted lines is not supported.
You must change the existing code in this line in order to create a valid suggestion.
Outdated suggestions cannot be applied.
This suggestion has been applied or marked resolved.
Suggestions cannot be applied from pending reviews.
Suggestions cannot be applied on multi-line comments.
Suggestions cannot be applied while the pull request is queued to merge.
Suggestion cannot be applied right now. Please check back later.