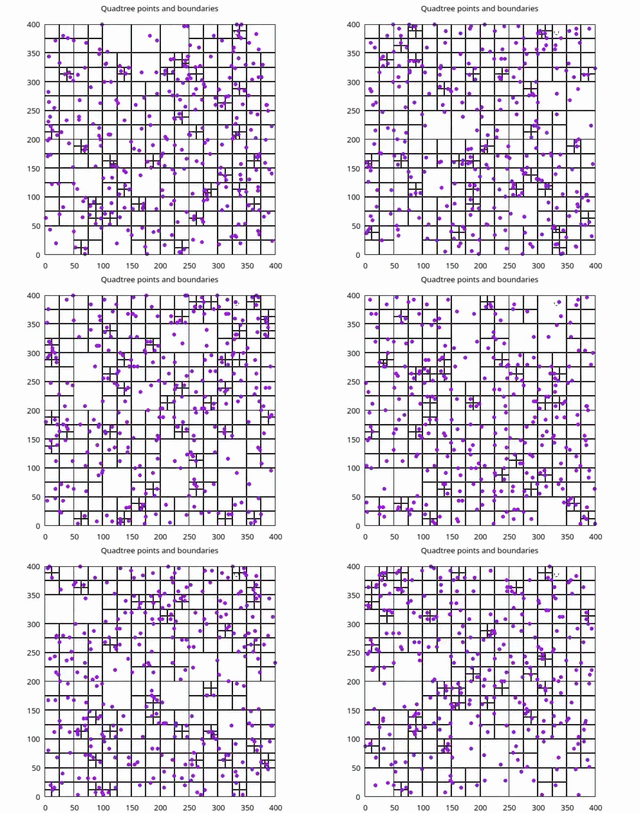
Quadtree is a data structure used to index spatial data. Each node always has 4 children. The branching strategy depends on the kind of quadtree. In this project, a point quadtree is implemented.
The idea is that each node represents a rectangel in 2D space. The rectangle can store a limited number of points. If its capacity is reached, a node gets divided into 4 NW, NE, SE, SW children (leaves), where its points get re-distributed. Some nice theoretical resources are found in [1], [2], [3].
To get some intuition, the schematic below shows what happens to a node of capacity of 2 when 3 points are sequentially inserted.
spatial representation:
capacity=2                                       NW                 NE
+--------------------+  +--------------------+  +--------------------+
|                    |  |                    |  |          |         |
|     *              |  |     *              |  |     *    |         |
|                    |  |                    |  |          |         |
|                    |  |                    |  |          |         |
|                    |  |                    |  |----------+---------|
|                    |  |                    |  |          |         |
|                    |  |                *   |  |       *  |     *   |
|                    |  |                    |  |          |         |
|                    |  |                    |  |          |         |
+--------------------+  +--------------------+  +--------------------+
                                                SW                  SE
tree representation:
     +--+                      +--+                      +--+
     |* |                      |**|                      |  |
     +--+                      +--+                      +--+
                                                          |
                                                          |
                                               +------+---+---+------+
                                               |      |       |      |
                                              +--+   +--+   +--+   +--+
                                              |* |   |  |   |* |   |* |
                                           NW +--+ NE+--+ SE+--+ SW+--+
.
├── examples                 <- directory where demos can be added
│   └── 01_particle_sim.c    <- demo
├── include
│   ├── quad.h               <- library
│   ├── viz_gplot.h          <- gnuplot plotter
│   ├── viz.h                <- plotter interface
│   └── viz_ppm.h            <- ppm frame plotter
├── src
│   ├── quad.c               <- library
│   ├── viz_gplot.c          <- gnuplot plotter
│   └── viz_ppm.c            <- ppm frame plotter
└── test
    ├── nanotest.h           <- unit test framework
    └── tests.c              <- unit tests
The visualizer plots the quadtree in real time either via a pipe fed to GNUplot or directly as .ppm frames. The quadtree library is independent from the visualizer.
maketo compile the project.gccis the default compiler, set in the Makefile.- To run the particle simulation: either
gnuplotor a media player;mpvhas been tested to work.
You can compile the example(s) with either GNUplot or .ppm frame emitter as the visualizer.
| gnuplot | ppm frames |
|---|---|
make |
make PLOTTER=PPM |
Then all demos under examples will be compiled against the library. All
executables will be generated in the root. A particle simulation to demonstrate
how the tree works has been written. To run it:
| gnuplot | ppm frames |
|---|---|
./01_particle_sim |
./01_particle_sim | mpv --no-correct-pts --fps=30 - |
To compile and run the unit tests:
make test
To clean all executables and object files:
make clean
[1] CMSC 420
[2] Dortmund
uni
[3] CS267 Berkley
