Skip to content

Conversation

qustavo
Copy link
Contributor

@qustavo qustavo commented Oct 6, 2021

This PR adds a new wallet metric: wallet_key_count which reports the current number of keys derived per account.
This metric is particularly useful when running a recovery with large gaps.

When recovering a node (see recovery.md) we need to specify a recovery window value:

The recovery window is a metric that the on-chain rescanner will use to determine when all the "used" addresses have been found. If the recovery window is two, lnd will fail to find funds in any addresses generated after the point in which two consecutive addresses were generated but never used. If an lnd on-chain wallet was extensively used, then users may want to increase the default value.

To find an accurate recovery window we could rely on the wallet key count (see lightningnetwork/lnd#5767).

This PR also bumps lndclient to :lnd-13-0 (https://github.com/lightninglabs/lndclient/tree/lnd-13-0) which introduces the ListAccounts call.

@carlaKC carlaKC self-requested a review October 20, 2021 14:10
Copy link
Contributor

@carlaKC carlaKC left a comment

Choose a reason for hiding this comment

The reason will be displayed to describe this comment to others. Learn more.

Thanks for the PR! Sorry that it took some time to get to review.
Just some versioning comments from me.

Any interest in adding these metrics to our provisioned grafana dashboards so they're more easily available?

Comment on lines 11 to 12
code := status.Code(err)
return code == codes.Unimplemented
Copy link
Contributor

Choose a reason for hiding this comment

The reason will be displayed to describe this comment to others. Learn more.

could inline this to status.Code(err) == codes.Unimplemented?

go.mod Outdated
github.com/prometheus/client_golang v0.9.3
github.com/stretchr/testify v1.5.1
golang.org/x/text v0.3.2 // indirect
github.com/lightninglabs/lndclient v1.0.1-0.20211001112454-5bb2b557e003
Copy link
Contributor

Choose a reason for hiding this comment

The reason will be displayed to describe this comment to others. Learn more.

We try to stick to tagged versions of lndclient, could you use v0.13.0-9? That should have all the calls you need.

Copy link
Contributor Author

Choose a reason for hiding this comment

The reason will be displayed to describe this comment to others. Learn more.

Sure! I used a branch instead of a tag because this change: lightninglabs/lndclient@5bb2b55, which is needed for the PR has not been tagged yet. As soon as it get tagged I can reference it here

Copy link
Contributor

Choose a reason for hiding this comment

The reason will be displayed to describe this comment to others. Learn more.

Ah my mistake, thought that was included in the 13-09 tag! Pushed v0.13.0-10 to lndclient now, you can use that :)

Copy link
Contributor Author

Choose a reason for hiding this comment

The reason will be displayed to describe this comment to others. Learn more.

awesome, thanks!

Comment on lines 196 to 197
// Nodes prior to version 0.13.0 don't implement ListAccounts and will
// return a Unimplemented error.
Copy link
Contributor

Choose a reason for hiding this comment

The reason will be displayed to describe this comment to others. Learn more.

If we bump to lndclient-13.0 it'll require that lnd is running at least lnd version 13.0 to start up (will fail for older clients).

We use this versioning to ensure that we're "safe" to use all new APIs and don't need to worry about unimplemented errors. Happy for this PR to just bump the required version to 13.0 and then we can assume that this API is supported.

Copy link
Contributor Author

Choose a reason for hiding this comment

The reason will be displayed to describe this comment to others. Learn more.

when bumped to 0.13.0 lndmon still works against a lnd-0.12.x though

Copy link
Contributor

Choose a reason for hiding this comment

The reason will be displayed to describe this comment to others. Learn more.

Ah yeah, we've specifically pinned minimum version to 0.11. If you just delete that CheckVersion field, it'll enforce lndclient's minimum version which aligns with the tag.

Copy link
Contributor Author

Choose a reason for hiding this comment

The reason will be displayed to describe this comment to others. Learn more.

I'm not sure I follow, if I delete CheckVersion we will drop versions older than 0.13? Is that something we want for this PR?

Copy link
Contributor

Choose a reason for hiding this comment

The reason will be displayed to describe this comment to others. Learn more.

Yes, generally when we update our projects to depend on a new API we bump the minimum version. Otherwise it can get awfully complex trying to figure out which endpoints we do/don't have access to. If you want to upgrade your lndmon to the version with this feature, you also need to bump you lnd node to at least 0.13.

Copy link
Contributor Author

Choose a reason for hiding this comment

The reason will be displayed to describe this comment to others. Learn more.

Ok, if we drop versions older than 0.13 then I can safely remove the status.Code(err) == codes.Unimplemented check right?

Copy link
Contributor

Choose a reason for hiding this comment

The reason will be displayed to describe this comment to others. Learn more.

Yeah exactly! Just makes life a lot easier :)

Copy link
Contributor Author

@qustavo qustavo Oct 26, 2021

Choose a reason for hiding this comment

The reason will be displayed to describe this comment to others. Learn more.

done!

@qustavo qustavo requested a review from carlaKC October 25, 2021 13:05
@qustavo
Copy link
Contributor Author

qustavo commented Oct 25, 2021

Any interest in adding these metrics to our provisioned grafana dashboards so they're more easily available?

how? is that dashboard open/public?

@guggero
Copy link
Contributor

guggero commented Oct 25, 2021

@qustavo
Copy link
Contributor Author

qustavo commented Oct 26, 2021

Yes, they're here: https://github.com/lightninglabs/lndmon/tree/master/grafana/provisioning/dashboards

Thanks, I added the metric to a new panel

Copy link
Contributor

@carlaKC carlaKC left a comment

Choose a reason for hiding this comment

The reason will be displayed to describe this comment to others. Learn more.

One question about metric label + issue with grafana, nearly there!

errChan chan<- error) *WalletCollector {

// these labels are specific for key_count metrics
keyCountLabels := []string{"account_name", "address_type"}
Copy link
Contributor

Choose a reason for hiding this comment

The reason will be displayed to describe this comment to others. Learn more.

Could internal and external be additional labels as well? Rather than needing to split out into two separate metrics? Since they seem functionally the same except for internal/external differentiation.

Copy link
Contributor Author

Choose a reason for hiding this comment

The reason will be displayed to describe this comment to others. Learn more.

Yes, that makes sense, will change it

Copy link
Contributor Author

Choose a reason for hiding this comment

The reason will be displayed to describe this comment to others. Learn more.

How would you call the label? I can think of visibility or context or external={true|false} ?

Copy link
Contributor

Choose a reason for hiding this comment

The reason will be displayed to describe this comment to others. Learn more.

key_type or key_branch?

Copy link
Contributor Author

Choose a reason for hiding this comment

The reason will be displayed to describe this comment to others. Learn more.

key_type it is

@qustavo qustavo force-pushed the wallet_key_count branch 2 times, most recently from 4800c9b to 910de60 Compare November 2, 2021 11:16
@qustavo qustavo requested a review from carlaKC November 2, 2021 11:17
Copy link
Contributor

@carlaKC carlaKC left a comment

Choose a reason for hiding this comment

The reason will be displayed to describe this comment to others. Learn more.

Metrics look good! Just need a little work on the dashboard.

"refId": "A"
}
],
"title": "Panel Title",
Copy link
Contributor

Choose a reason for hiding this comment

The reason will be displayed to describe this comment to others. Learn more.

Name for the panel rather than "panel title"?

@carlaKC
Copy link
Contributor

carlaKC commented Nov 5, 2021

I would suggest something like:

Screenshot 2021-11-05 at 11 24 11

{
  "type": "graph",
  "title": "Address Types",
  "gridPos": {
    "x": 12,
    "y": 16,
    "w": 12,
    "h": 9
  },
  "datasource": "Prometheus",
  "aliasColors": {},
  "bars": true,
  "dashLength": 10,
  "dashes": false,
  "description": "",
  "fill": 1,
  "fillGradient": 0,
  "hiddenSeries": false,
  "id": 13,
  "legend": {
    "avg": false,
    "current": false,
    "max": false,
    "min": false,
    "show": false,
    "total": false,
    "values": false
  },
  "lines": false,
  "linewidth": 1,
  "nullPointMode": "null",
  "options": {
    "dataLinks": []
  },
  "percentage": false,
  "pointradius": 2,
  "points": false,
  "renderer": "flot",
  "seriesOverrides": [],
  "spaceLength": 10,
  "stack": false,
  "steppedLine": false,
  "targets": [
    {
      "refId": "A",
      "expr": "lnd_wallet_key_count",
      "intervalFactor": 1,
      "format": "time_series",
      "legendFormat": "{{address_type}}"
    }
  ],
  "thresholds": [],
  "timeFrom": null,
  "timeRegions": [],
  "timeShift": null,
  "tooltip": {
    "shared": false,
    "sort": 0,
    "value_type": "individual"
  },
  "xaxis": {
    "buckets": null,
    "mode": "series",
    "name": null,
    "show": true,
    "values": [
      "max"
    ]
  },
  "yaxes": [
    {
      "format": "short",
      "label": null,
      "logBase": 1,
      "max": null,
      "min": null,
      "show": true
    },
    {
      "format": "short",
      "label": null,
      "logBase": 1,
      "max": null,
      "min": null,
      "show": true
    }
  ],
  "yaxis": {
    "align": false,
    "alignLevel": null
  },
  "links": []
}

Screenshot 2021-11-05 at 11 24 29

{
  "type": "graph",
  "title": "Address Types",
  "gridPos": {
    "x": 0,
    "y": 25,
    "w": 12,
    "h": 9
  },
  "datasource": "Prometheus",
  "aliasColors": {},
  "bars": true,
  "dashLength": 10,
  "dashes": false,
  "description": "",
  "fill": 1,
  "fillGradient": 0,
  "hiddenSeries": false,
  "id": 12,
  "legend": {
    "avg": false,
    "current": false,
    "max": false,
    "min": false,
    "show": false,
    "total": false,
    "values": false
  },
  "lines": false,
  "linewidth": 1,
  "nullPointMode": "null",
  "options": {
    "dataLinks": []
  },
  "percentage": false,
  "pointradius": 2,
  "points": false,
  "renderer": "flot",
  "seriesOverrides": [],
  "spaceLength": 10,
  "stack": false,
  "steppedLine": false,
  "targets": [
    {
      "refId": "A",
      "expr": "sum(lnd_wallet_key_count{key_type=\"internal\"})",
      "intervalFactor": 1,
      "format": "time_series",
      "legendFormat": "Internal Key Count"
    },
    {
      "refId": "B",
      "expr": "sum(lnd_wallet_key_count{key_type=\"external\"})",
      "intervalFactor": 1,
      "format": "time_series",
      "legendFormat": "External Key Count"
    }
  ],
  "thresholds": [],
  "timeFrom": null,
  "timeRegions": [],
  "timeShift": null,
  "tooltip": {
    "shared": false,
    "sort": 0,
    "value_type": "individual"
  },
  "xaxis": {
    "buckets": null,
    "mode": "series",
    "name": null,
    "show": true,
    "values": [
      "max"
    ]
  },
  "yaxes": [
    {
      "format": "short",
      "label": null,
      "logBase": 1,
      "max": null,
      "min": null,
      "show": true
    },
    {
      "format": "short",
      "label": null,
      "logBase": 1,
      "max": null,
      "min": null,
      "show": true
    }
  ],
  "yaxis": {
    "align": false,
    "alignLevel": null
  },
  "links": []
}

You'd need to update this json a bit (datasource, namespace, better titles etc), but should get you most of the way there.

@qustavo
Copy link
Contributor Author

qustavo commented Nov 9, 2021

You are suggesting two different panels? or both graphs belong to the same panel?
Also, I'm using "datasource": "$datasource" following what it's already in the rest of the dashboards, in your example it is using "datasource": "Prometheus", is that changed on purpose?

@qustavo qustavo force-pushed the wallet_key_count branch 2 times, most recently from 595f558 to e0eca07 Compare November 9, 2021 14:49
@qustavo qustavo requested a review from carlaKC December 8, 2021 09:08
@carlaKC
Copy link
Contributor

carlaKC commented Dec 13, 2021

Sorry somehow completely missed this comment!

You are suggesting two different panels?

Was thinking 2x panels?

"datasource": "Prometheus", is that changed on purpose?

Nope, should be "$datasource", those are just my local deafults.

Copy link
Contributor

@carlaKC carlaKC left a comment

Choose a reason for hiding this comment

The reason will be displayed to describe this comment to others. Learn more.

Could you post a screenshot of what your dash looks like with these changes? Mine is kinda unreadable.

Screenshot 2021-12-13 at 12 29 31

Can also cut the dashboard part/ add in a follow up to get the prometheus change in.

@qustavo
Copy link
Contributor Author

qustavo commented Dec 22, 2021

@carlaKC I just noticed that and it happened when I started using lnd-0.14.0. Earlier versions only have a default account but 0.14.0 now has more accounts (named act:<N>) . So my initial chart is rendering well, I'll need to investigate and see what's the best way to display this info.

@qustavo
Copy link
Contributor Author

qustavo commented Dec 22, 2021

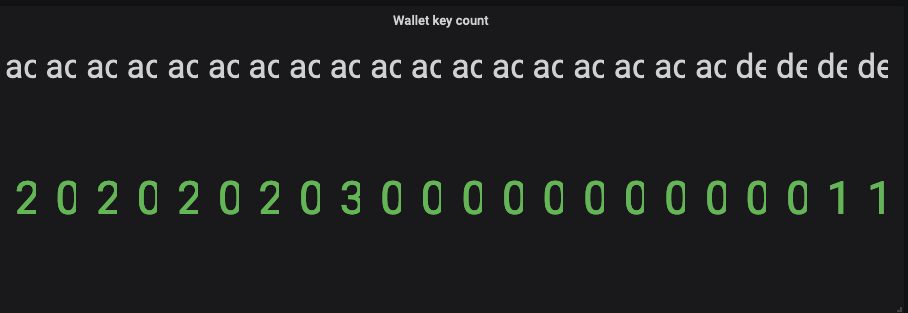
After filtering out the non-default wallets in the chart this is the result:
Screenshot_2021-12-22_09-48-05
Screenshot_2021-12-22_09-46-56

Also, are they all the collected metrics rendered as charts? do we need to do that for this one?

@qustavo qustavo requested a review from carlaKC December 29, 2021 15:34
@carlaKC
Copy link
Contributor

carlaKC commented Jan 4, 2022

@carlaKC I just noticed that and it happened when I started using lnd-0.14.0. Earlier versions only have a default account but 0.14.0 now has more accounts (named act:<N>) . So my initial chart is rendering well, I'll need to investigate and see what's the best way to display this info.

Ah interesting! Difficult to display succinctly.

We could just change the existing chart to a graph and go with something like this:
Screenshot 2022-01-04 at 15 09 02

It's not pretty, but has all the information exposed at least.

Also, are they all the collected metrics rendered as charts? do we need to do that for this one?

Generally metrics are, but it's not a strict requirement. If you want to just drop the grafana change, we can just merge the addition of the metric to prometheus!

@qustavo
Copy link
Contributor Author

qustavo commented Jan 5, 2022

I prefer to drop the changes to Grafana since it is not pretty to display, and different users might need different chart details/accounts.
Will update the PR now

Copy link
Contributor

@carlaKC carlaKC left a comment

Choose a reason for hiding this comment

The reason will be displayed to describe this comment to others. Learn more.

🏅

@carlaKC carlaKC requested a review from ellemouton January 5, 2022 08:46
@lightninglabs-deploy
Copy link

@ellemouton: review reminder

Copy link
Member

@ellemouton ellemouton left a comment

Choose a reason for hiding this comment

The reason will be displayed to describe this comment to others. Learn more.

Looks good ⭐ Left a few optional nits and one comment about a comment that looks a bit out of place

float64(walletBal.Unconfirmed),
)

accounts, err := u.lnd.WalletKit.ListAccounts(context.Background(), "", 0)
Copy link
Member

Choose a reason for hiding this comment

The reason will be displayed to describe this comment to others. Learn more.

nit: wrap at 80 chars

Copy link
Contributor Author

Choose a reason for hiding this comment

The reason will be displayed to describe this comment to others. Learn more.

isn't it already below 80? (vim shows :78)

Copy link
Member

Choose a reason for hiding this comment

The reason will be displayed to describe this comment to others. Learn more.

mine shows 83. Is your tab size set to 8 spaces?

@ellemouton
Copy link
Member

thanks for the quick update @qustavo 🚀 almost there, just need to also rebase master as your pr now includes some other commits

Copy link
Member

@ellemouton ellemouton left a comment

Choose a reason for hiding this comment

The reason will be displayed to describe this comment to others. Learn more.

LGTM 🚀

@carlaKC carlaKC merged commit a1fa10f into lightninglabs:master Jan 12, 2022
@qustavo qustavo deleted the wallet_key_count branch January 12, 2022 14:31
Sign up for free to join this conversation on GitHub. Already have an account? Sign in to comment
Labels
None yet
Projects
None yet
Development

Successfully merging this pull request may close these issues.

5 participants