![]()
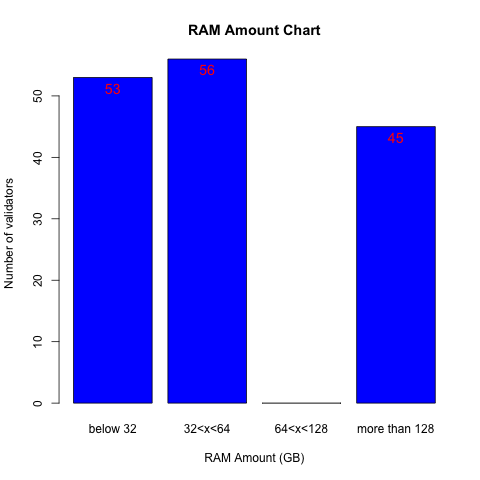
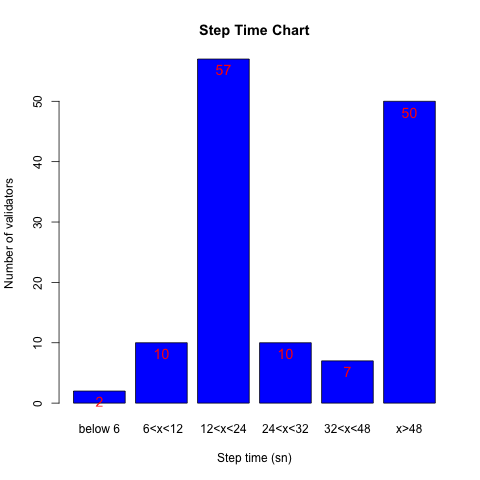
This package aims to visualise step time and RAM amount of Casper validators.
- httr, can be installed by issuing the following command (within RStudio command line)
install.packages('httr')
- tidyverse, can be installed by issuing the following command (within RStudio command line)
install.packages('tidyverse')
- shiny, can be installed by issuing the following command (within RStudio command line)
install.packages('shiny')
- jsonlite, can be installed by issuing the following command (within RStudio command line)
install.packages('jsonlite')
- devtools, can be installed by issuing the following command (within RStudio command line)
install.packages('devtools')
- Install devtools by issuing the following command (within RStudio command line)
install.packages('devtools')
- Then load the devtools package with by issuing the following command (within RStudio command line)
library(devtools)
- Then, to build the package, type by issuing the following command (at the end of the main script)
build()
This will create the PACKAGE_NAME.tar.gz file.
- will be updated
- Clone repository by typing following command (within command line)
git clone https://github.com/socodes/Casper-validator-metrics-charts
- to install the application, you’d issue the following command
from R:
devtools::install()
OR
from command line:
R CMD INSTALL Call_1.0.0.tar.gz
- Run the following script which is inside the R folder of repository
Rscript R/main.R
- Install required R language version from https://www.r-project.org
- install required packages from command line as: install.package(PACKAGE_NAME)
- Change current working directory to repository location.
- Run the following script which is inside the R folder of repository
Rscript R/main.R
- Sufficient amount of time should be given to program in order to generate outputs.